Translation for mere mortals like me: "sensors"
:-)

The coolest part about reality-mining is the notion of visualizing the output of sensor type data in novel ways. So I figured I'd apply that concept to the Modern Device / Liquidware sensors. Starting with the Compass Sensor.
 This is the code that gets uploaded onto the Arduino:
#include <Wire.h>
#include <LibCompass.h>
#include <HardwareSensor.h>

LibCompass compass = LibCompass(0);

void setup() {
 Serial.begin(9600);
 Sensor.begin(19200);
}

int c;

void loop() {
 c = (int)compass.GetHeading();
 Sensor.print("1", c);
 Sensor.print("2", 360-c);
 delay(5);
}
And this is the code that gets uploaded onto the TouchShield Slide:
#include <HardwareSensor.h>

void setup() {
    Sensor.begin(19200);
    background(0);

}

int val,x,y;
int lastx = 0;
int lasty = 0;
char name[5];

void loop() {

  if (Sensor.available()) {
        int value;
        value = Sensor.read();
        x = lastx; y = lasty;
        if (strcmp ( Sensor.getName() , "1" )) x = value / 4;
        if (strcmp ( Sensor.getName() , "2" )) y = value / 4;

        stroke(128); line(300,10,300,230);

        if (x < x =" 0;"> 100) x = 100;
        if (y < y =" 0;"> 100) y = 100;

        if (x != lastx) {
          noStroke();
          fill(50);
          rect( 20+3*x, 26 , 279-3*x , 81 );
          fill( 0);
          rect( 20    , 26 ,    3*x  , 81 );
        };

        if (y != lasty) {
          noStroke();
          fill(50);
          rect( 20+3*y, 133 , 279-3*y , 81 );
          fill( 0);
          rect( 20    , 133 ,    3*y  , 81 );
        };


        lastx=x; lasty=y;
    }
}
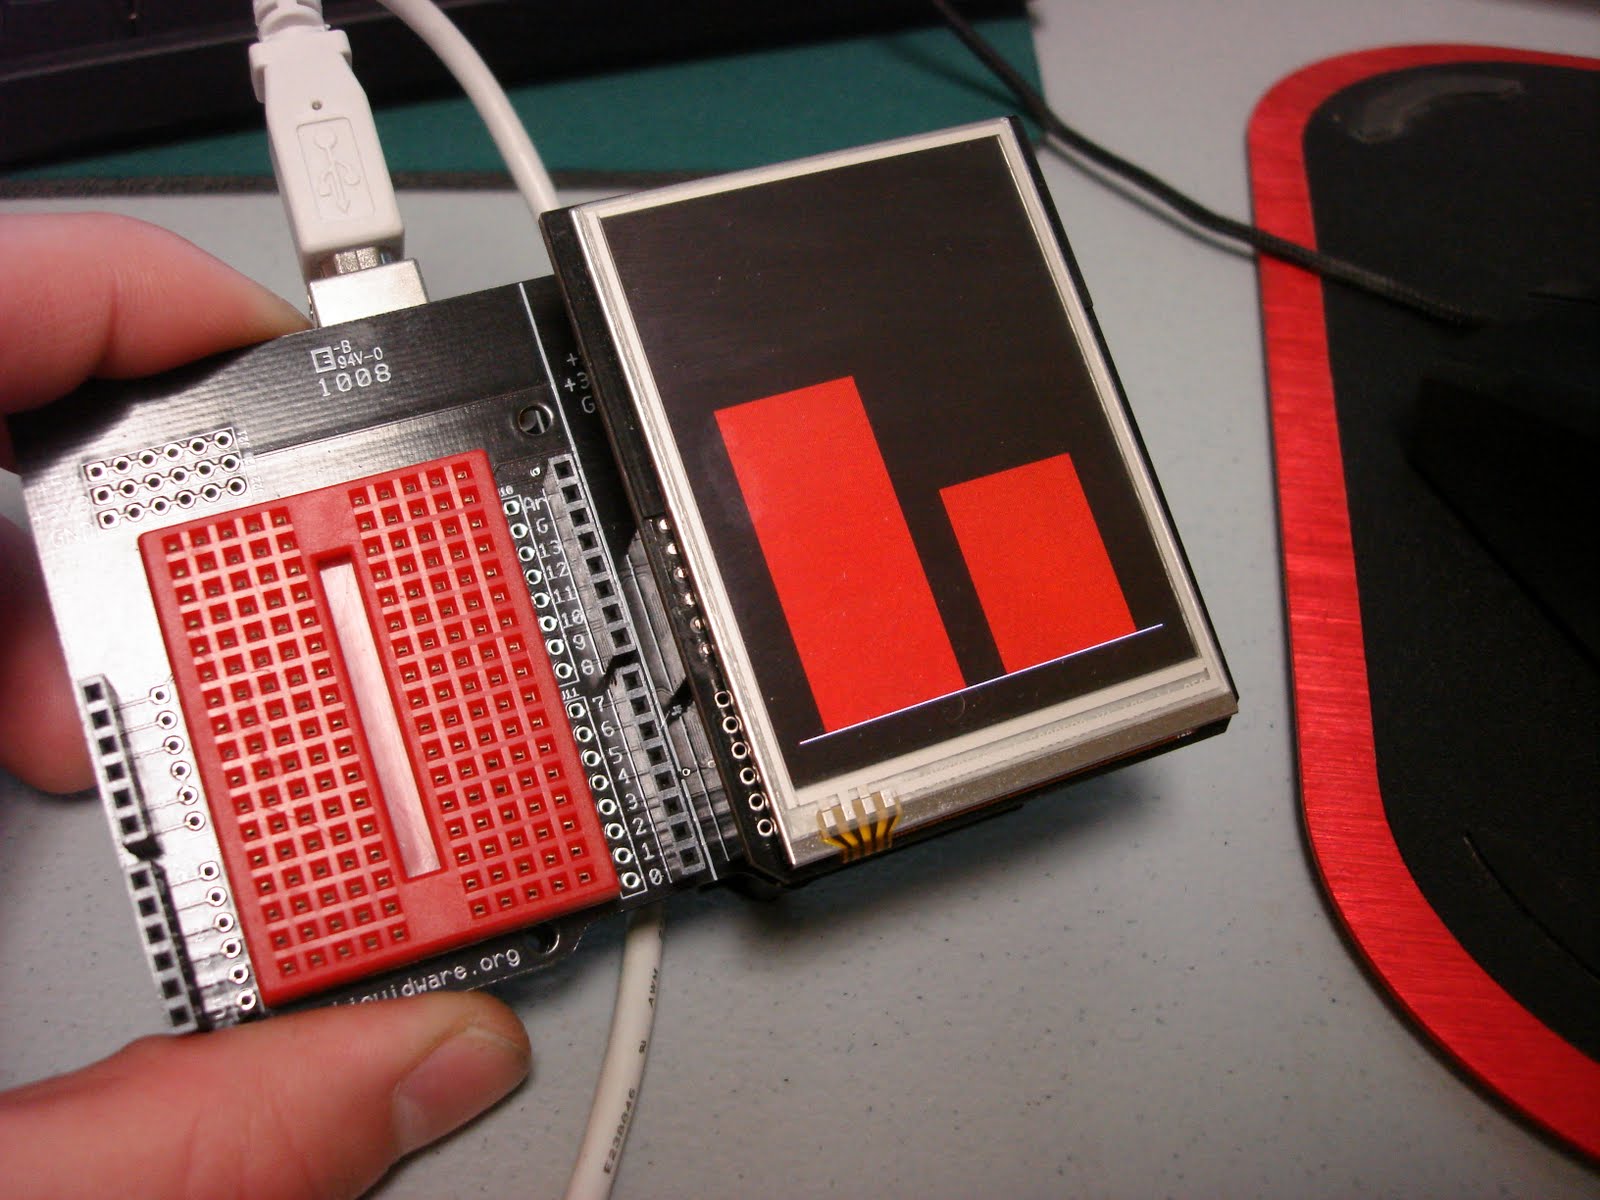
The code on the Arduino polls the Compass Module Sensor, and then sends the values to the TouchShield Slide using the HardwareSensor.h library that Chris built (available as a built-in library if you download the Arduino Antipasto IDE). Then the TouchShield Slide polls the Arduino's sensor values, and displays bar graphs. The result is nice, smooth-flowing, no-flickering bar graphs that show the values of the sensor in real time...
Here's a picture showing the bar graphs tilted to one side:

And this is probably my favorite picture of the bunch:

Enjoy!
No comments:
Post a Comment